
If you’re building a Business Central extension, you probably already benefit from the built-in telemetry that the platform sends to Azure Application Insights—long running AL methods, long running operations (SQL), web service calls, report generation times, and more. But what about the things that are specific to your extension? Maybe you need to know when a critical integration call fails, how often users trigger a particular workflow, or which branch of a complex calculation is being hit in production.
That’s where custom telemetry events come in. With a single LogMessage call in your AL code, you can send your own trace signals to Azure Application Insights, giving you visibility into exactly what your extension is doing in the real world. This article walks through how it works, when to use it, and the recommended approach that will save you headaches down the road.
You can find the full code for the example on GitHub.
Telemetry vs. Traditional Event Logging
Before exploring the how, it’s worth understanding the distinction. Traditional event logging—like writing to the Windows event log on a Business Central Server instance—focuses on infrastructure: server errors, deployment issues, performance counters. Telemetry is different. It’s about collecting data on what users are doing inside the application and how your code is behaving in production environments.
Azure Application Insights is the recommended destination for telemetry in Business Central. It works for both online and on-premises deployments, and it gives you powerful querying capabilities through Kusto Query Language (KQL) as well as some other community driven tools such as Waldo’s BC Telemetry Buddy.
Where Telemetry Gets Sent
When you emit a custom telemetry event from your extension, there are two possible destinations:
- Extension publisher’s Application Insights — the Azure Application Insights resource configured in your extension’s
app.jsonfile. - Environment Application Insights — the resource configured by the admin on the Business Central environment itself.
You control which destination receives your events through the TelemetryScope parameter:
TelemetryScope::ExtensionPublisher— sends the event only to the Application Insights resource defined in your extension’sapp.json.TelemetryScope::All— sends the event to both the extension’s resource and the environment’s resource.
This scoping is useful. If you’re an ISV, you might want some internal diagnostics to stay in your own Application Insights resource (ExtensionPublisher), while other events—like feature usage or error conditions that an admin should know about—go to both destinations (All).
It’s worth noting that having an Application Insights resource configured in your app.json is not required to use custom telemetry. If you only use TelemetryScope::All, the events will be sent to the environment’s resource (if one is configured).
The LogMessage Method
The core of custom telemetry is Session.LogMessage. There are two overloads—one that accepts a Dictionary of custom dimensions, and one that lets you pass dimension name/value pairs directly as parameters.
Dictionary overload:
Session.LogMessage(
    EventId: String,
    Message: String,
    Verbosity: Verbosity,
    DataClassification: DataClassification,
    TelemetryScope: TelemetryScope,
    CustomDimensions: Dictionary of [Text, Text]
)
Dimension overload (up to two dimensions):
Session.LogMessage(
    EventId: String,
    Message: String,
    Verbosity: Verbosity,
    DataClassification: DataClassification,
    TelemetryScope: TelemetryScope,
    Dimension1: String, Value1: String
    [, Dimension2: String] [, Value2: String]
)
Both methods can be called from any AL object—Codeunits, pages, reports, triggers, or methods. Let’s break down the parameters.
Understanding the Parameters
| Parameter | Purpose |
|---|---|
EventId |
A text identifier for the event (e.g., MYEXT-0001). Use a prefix unique to your extension. Note: Business Central automatically prefixes your custom EventId with al |
Message |
A descriptive message for the trace signal. |
Verbosity |
Severity level: Critical, Error, Warning, Normal, or Verbose. |
DataClassification |
Must be SystemMetadata for events to be sent to Application Insights. |
TelemetryScope |
Controls the destination: ExtensionPublisher or All. |
CustomDimensions |
A Dictionary of [Text, Text] with your custom key/value pairs. |
A couple of these deserve extra emphasis:
- DataClassification: For privacy reasons, only events with
DataClassification::SystemMetadataare sent to Azure Application Insights. If you use any other classification, the event won’t be transmitted. This is by design—it prevents customer data from accidentally leaking into telemetry resources. - Verbosity: For on-premises deployments, the Diagnostic Trace Level setting on the Business Central Server instance controls which severity levels are sent. If the trace level is set to
Warning, thenNormalandVerbosesignals won’t reach Application Insights.
A Practical Example
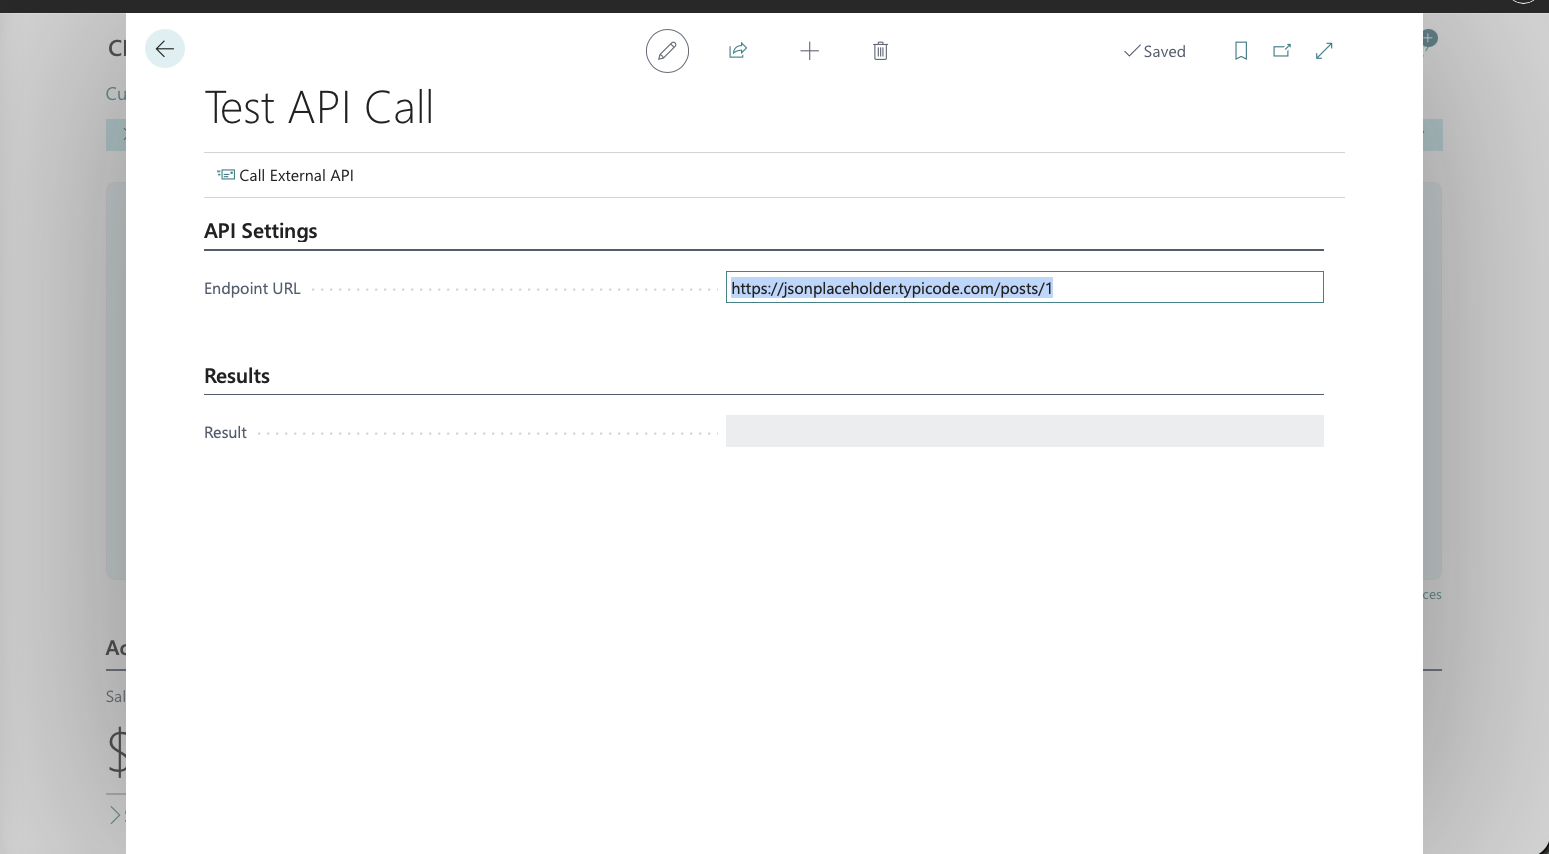
Let’s say your extension integrates with an external API and you want to log both successful calls and failures. Here’s how you might structure that:
codeunit 50100 "DVLPR API Integration"
{
    procedure CallExternalApi(Endpoint: Text): Boolean
    var
        Client: HttpClient;
        Response: HttpResponseMessage;
        Dimensions: Dictionary of [Text, Text];
        Success: Boolean;
    begin
        Success := Client.Get(Endpoint, Response);

        Dimensions.Add('Endpoint', Endpoint);
        Dimensions.Add('HttpStatusCode', Format(Response.HttpStatusCode()));
        Dimensions.Add('Success', Format(Success and Response.IsSuccessStatusCode()));

        if Success and Response.IsSuccessStatusCode() then begin
            LogMessage(
                'DVLPR-1001',
                'External API called successfully',
                Verbosity::Normal,
                DataClassification::SystemMetadata,
                TelemetryScope::ExtensionPublisher,
                Dimensions
            );
            exit(true);
        end;

        LogMessage(
            'DVLPR-1002',
            'External API call failed',
            Verbosity::Error,
            DataClassification::SystemMetadata,
            TelemetryScope::All,
            Dimensions
        );
        exit(false);
    end;
}
A few things to notice:
- The success event uses
TelemetryScope::ExtensionPublisherbecause it’s routine operational data the ISV cares about. - The failure event uses
TelemetryScope::Allbecause the environment admin might also want to know about failures. - Each event has a unique
EventId(DVLPR-1001andDVLPR-1002), which makes it easy to find specific events in Application Insights. - The
Endpointdimension is included in both calls so you can filter and group by endpoint in KQL queries.
For simpler scenarios, you can skip the dictionary and use the dimension overload:
LogMessage(
    'DVLPR-2001',
    'Order import completed',
    Verbosity::Normal,
    DataClassification::SystemMetadata,
    TelemetryScope::ExtensionPublisher,
    'OrderCount', Format(OrderCount),
    'DurationMs', Format(Duration)
);
This is convenient when you only need one or two dimensions.
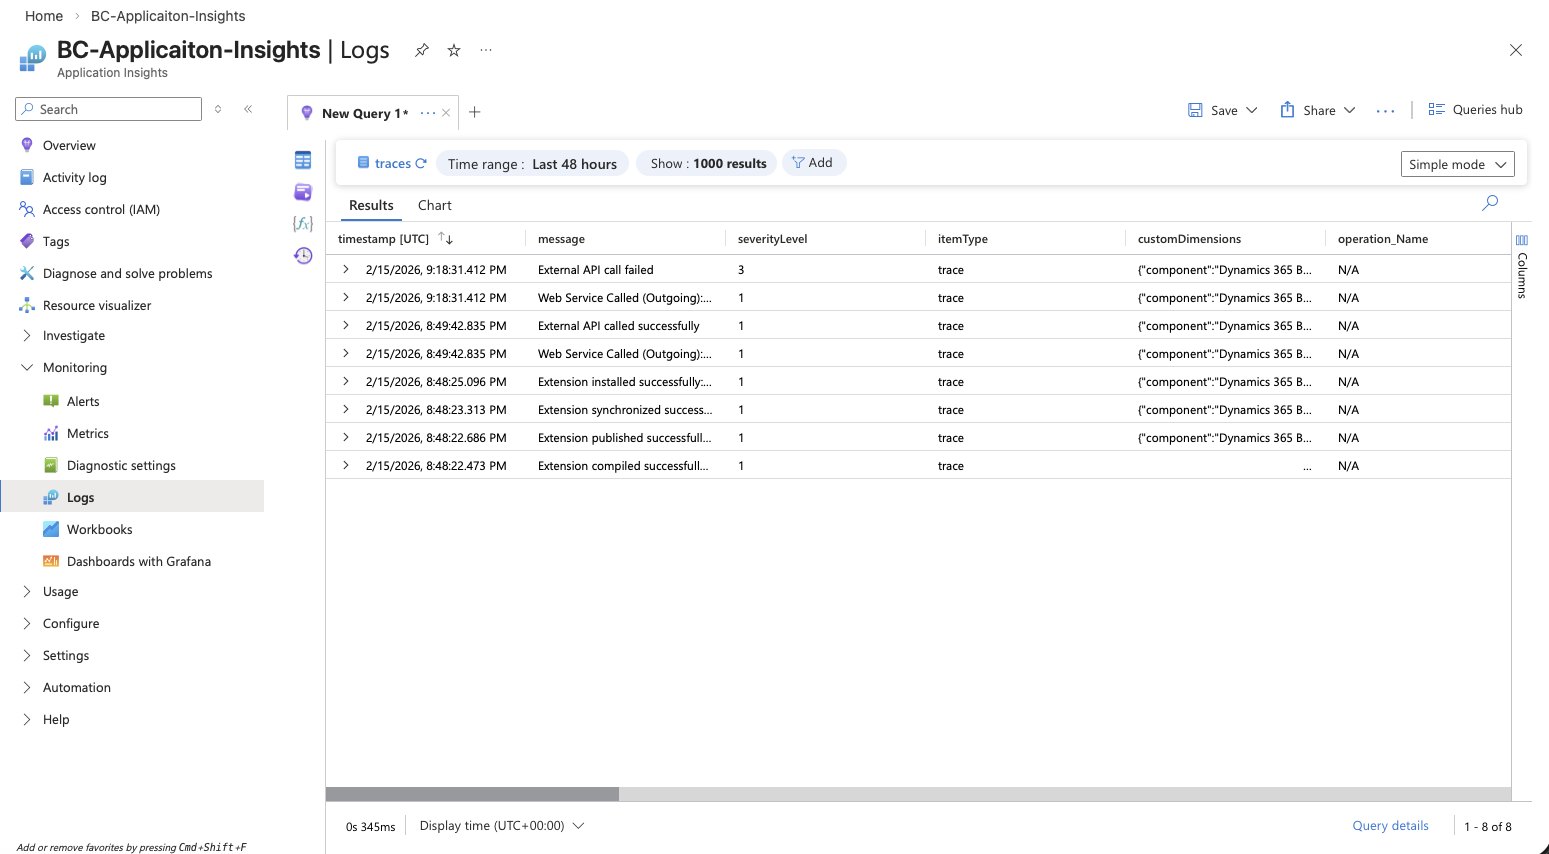
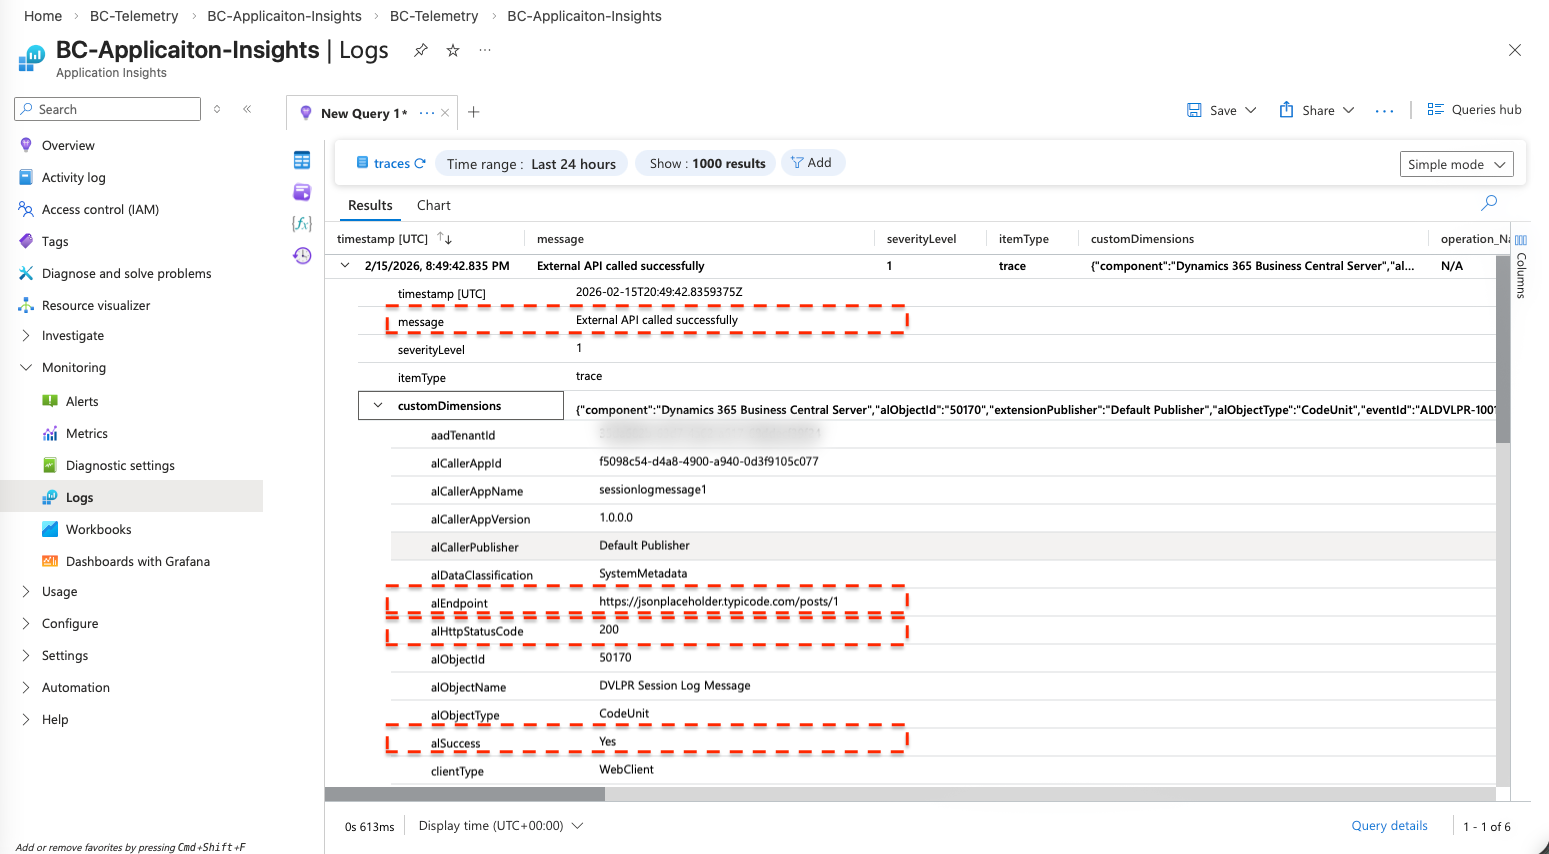
What Shows Up in Application Insights
When your event arrives in Azure Application Insights, it lands in the traces table. The Message and Verbosity appear as general dimensions. Everything else appears as custom dimensions.
One important detail: Similar to EventIds, Business Central automatically prefixes your custom dimension keys with al. So if you define a dimension called OrderCount in your AL code, it appears as alOrderCount in Application Insights. Because of this, use PascalCasing for your dimension names—OrderCount, not order_count or order count. This keeps your custom dimensions consistent with how built-in Business Central telemetry dimensions are named.
You also get a set of default dimensions for free on every event, including:
alObjectId/alObjectName/alObjectType— which object emitted the event.extensionName/extensionId/extensionVersion— which extension the event came from.environmentName/environmentType— which environment it happened in.companyName— which company was active.clientType— what type of client triggered the code (Web, Background, API, etc.).
These built-in dimensions are incredibly useful for filtering. You don’t need to add them yourself.
Recommended Approach
The Business Central team treats telemetry event definitions as an API—and you should too. Here are the key practices to follow:
- Use unique EventIds. Every
LogMessagecall in your code should have a distinctEventId. This makes it trivial to pinpoint where in the code a particular event was emitted. Use a prefix unique to your extension (e.g.,DVLPR-,CONTOSO-). - Follow the “Object ActionInPastTense” pattern for messages. Instead of
"Calling API", write"External API called"or"Order import completed". This reads naturally in a KQL query ordered by timestamp. Consider including key dimension values in the message itself so you can scan events without opening custom dimensions every time. - Don’t use spaces in dimension names. Spaces make KQL queries harder to write. Stick to PascalCase:
OrderCount, notOrder Count. - Treat dimension changes as breaking changes. Once your extension is in production and people have built alerts or Power BI reports on your telemetry, renaming or removing a dimension will break their work. Add new dimensions freely, but be cautious about changing existing ones.
- Keep DataClassification as SystemMetadata. Events with any other classification won’t be sent. Review your
LogMessagecalls to make sure you’re not accidentally including personal or customer data in dimension values. - Make events actionable. Before adding a telemetry event, ask yourself: “What can someone do with this information?” If the answer isn’t clear, reconsider whether the event is worth adding.
- Don’t over-instrument. Telemetry costs money (Application Insights charges by data volume) and adds overhead. Focus on events that provide diagnostic or usage value. High-frequency loops are not good candidates for telemetry.
Feature Telemetry Module
It’s worth mentioning the Feature Telemetry module from the System Application. This module provides a higher-level abstraction over Session.LogMessage and is particularly useful for tracking feature usage. Instead of calling LogMessage directly, you call FeatureTelemetry.LogUsage or FeatureTelemetry.LogError, and the module handles the event structure for you.
If your primary goal is tracking which features in your extension are being used (and which aren’t), the Feature Telemetry module is often a better fit than raw LogMessage calls. You can learn more about it in the Microsoft documentation on Using Feature telemetry.
Wrapping Up
Custom telemetry events give you a direct window into how your extension behaves in production. With LogMessage, you can emit targeted signals from anywhere in your AL code, control where those signals land through telemetry scoping, and attach rich custom dimensions that make analysis in Application Insights straightforward.
The investment is minimal—a handful of well-placed LogMessage calls—but the payoff is significant. You get real production diagnostics, usage patterns, and error tracking without needing access to the customer’s environment. Start with your most critical code paths (integrations, complex calculations, error handlers) and expand from there.
Learn more:
- Instrumenting an application for telemetry (Microsoft Learn)
- Creating custom telemetry events for Azure Application Insights (Microsoft Learn)
- Using Feature telemetry (Microsoft Learn)
Note: The code and information discussed in this article are for informational and demonstration purposes only. This content was written referencing Microsoft Dynamics 365 Business Central 2025 Wave 2 online. Custom telemetry events via LogMessage are available from Business Central 2020 release wave 2 and later. Always test in a sandbox first.