
If you’ve read anything about monitoring Business Central—whether it’s tracking long-running queries, failed web service calls, or your own custom telemetry events—the advice always starts with, “Send it to Application Insights.” But if you haven’t set one up before, the Azure portal can feel a bit overwhelming. There are resource groups, workspaces, connection strings, and a few easy-to-miss settings that can trip you up.
This post walks through the entire setup from scratch: Creating the Azure resources, wiring the connection string into your AL extension’s app.json, and then trimming the noise with transformation rules so you’re only paying for the telemetry you actually need.
You can find the full code for the example on GitHub.
What We’re Building
By the end of this walkthrough, you’ll have:
- A dedicated Resource Group in Azure to keep your Business Central telemetry resources organized.
- A Log Analytics Workspace that stores the underlying log data.
- An Application Insights resource connected to that workspace and ready to receive telemetry.
- Your AL extension (or Business Central environment) configured to send telemetry to that resource.
- Transformation rules in place to reduce data volume and cost.
Let’s get started.
Part 1: Creating the Azure Resources
All three resources are created in the Azure portal (portal.azure.com). You’ll need an active Azure subscription with permissions to create resources.
Step 1 — Create a Resource Group
A resource group is a logical container in Azure. Grouping your telemetry resources together makes them easy to find, manage, and clean up later.
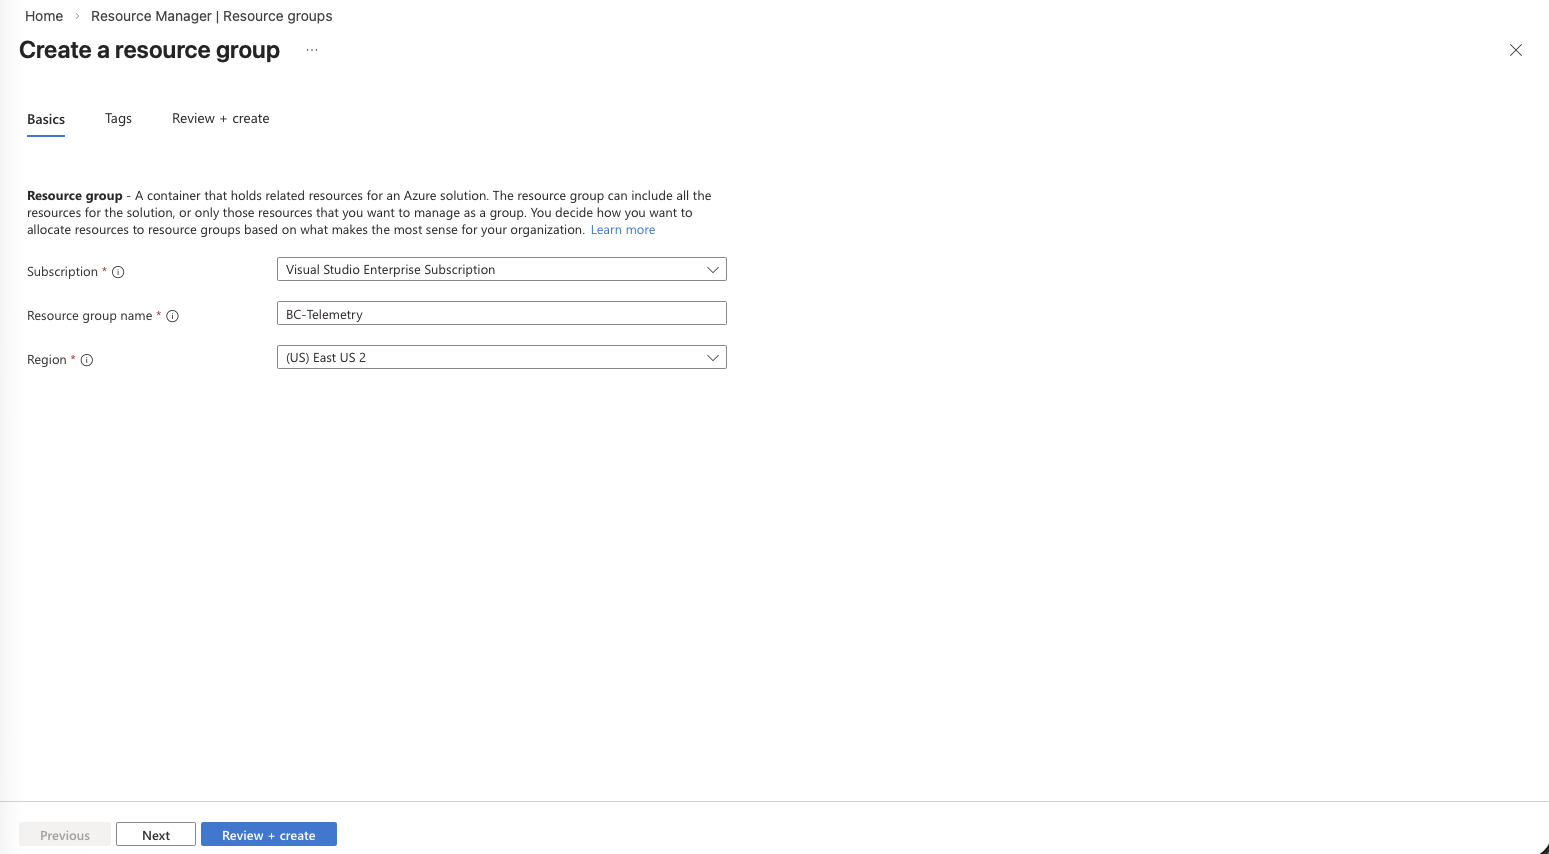
- Navigate to the Azure portal and sign in.
- Search for Resource groups in the top search bar and select it.
- Click + Create.
- Select your Subscription.
- Enter the Resource group name:
BC-Telemetry. - Select a Region close to your Business Central environment (e.g., East US, West Europe).
- Click Review + create, then Create.
That’s it—your container is ready.
Step 2 — Create a Log Analytics Workspace
Application Insights uses a Log Analytics workspace as its backing store. This is a workspace-based model that Microsoft now requires for all new Application Insights resources.
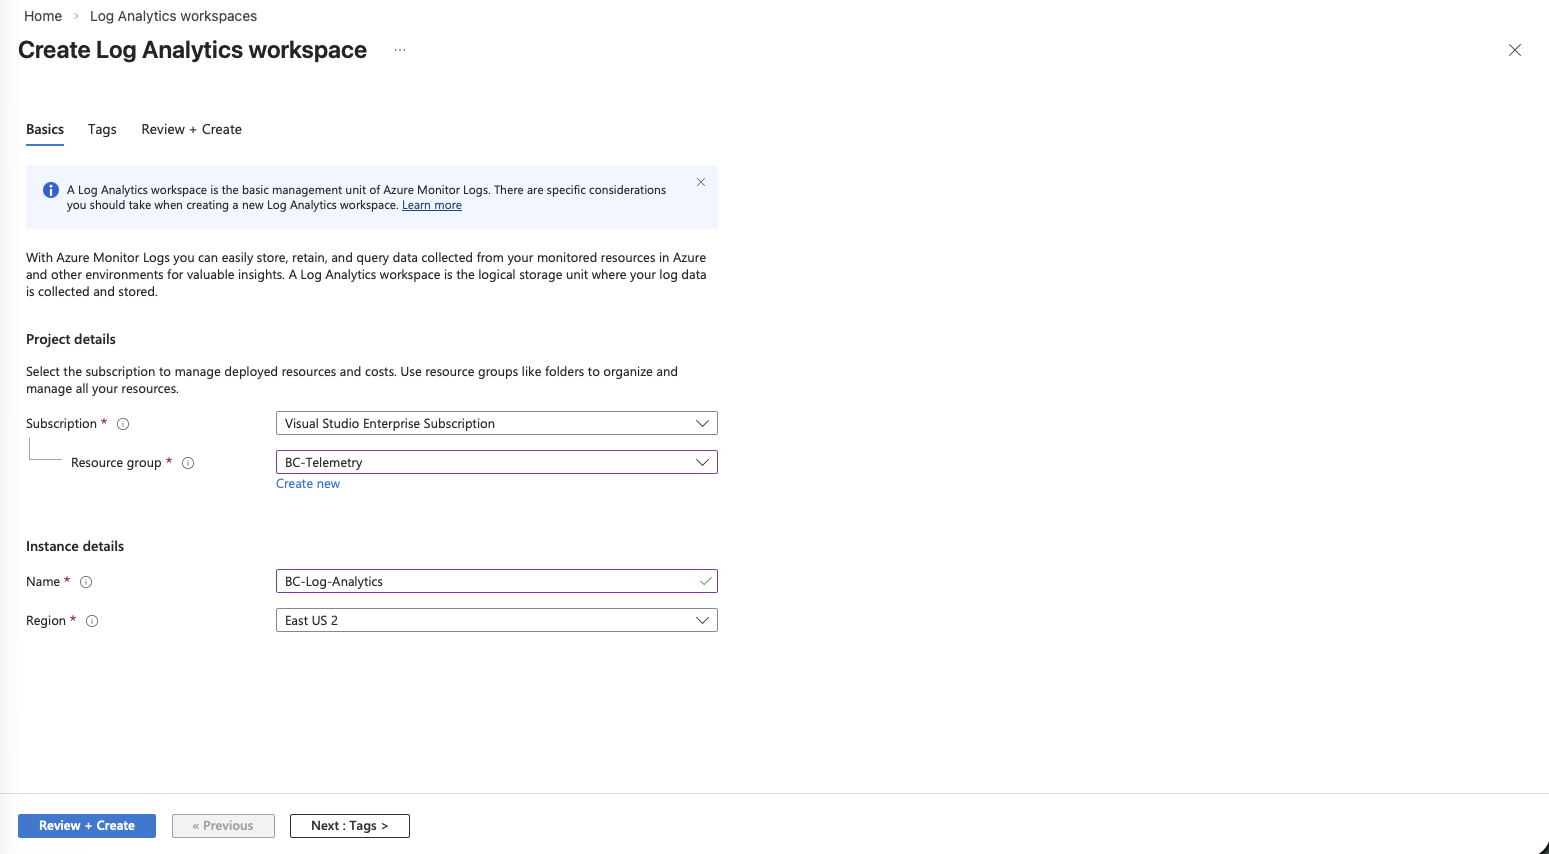
- In the Azure portal, search for Log Analytics workspaces and select it.
- Click + Create.
- Set the Subscription and Resource group to
BC-Telemetry. - Enter a Name (e.g.,
BC-Log-Analytics). The name must be globally unique. - Select the same Region you used for the resource group.
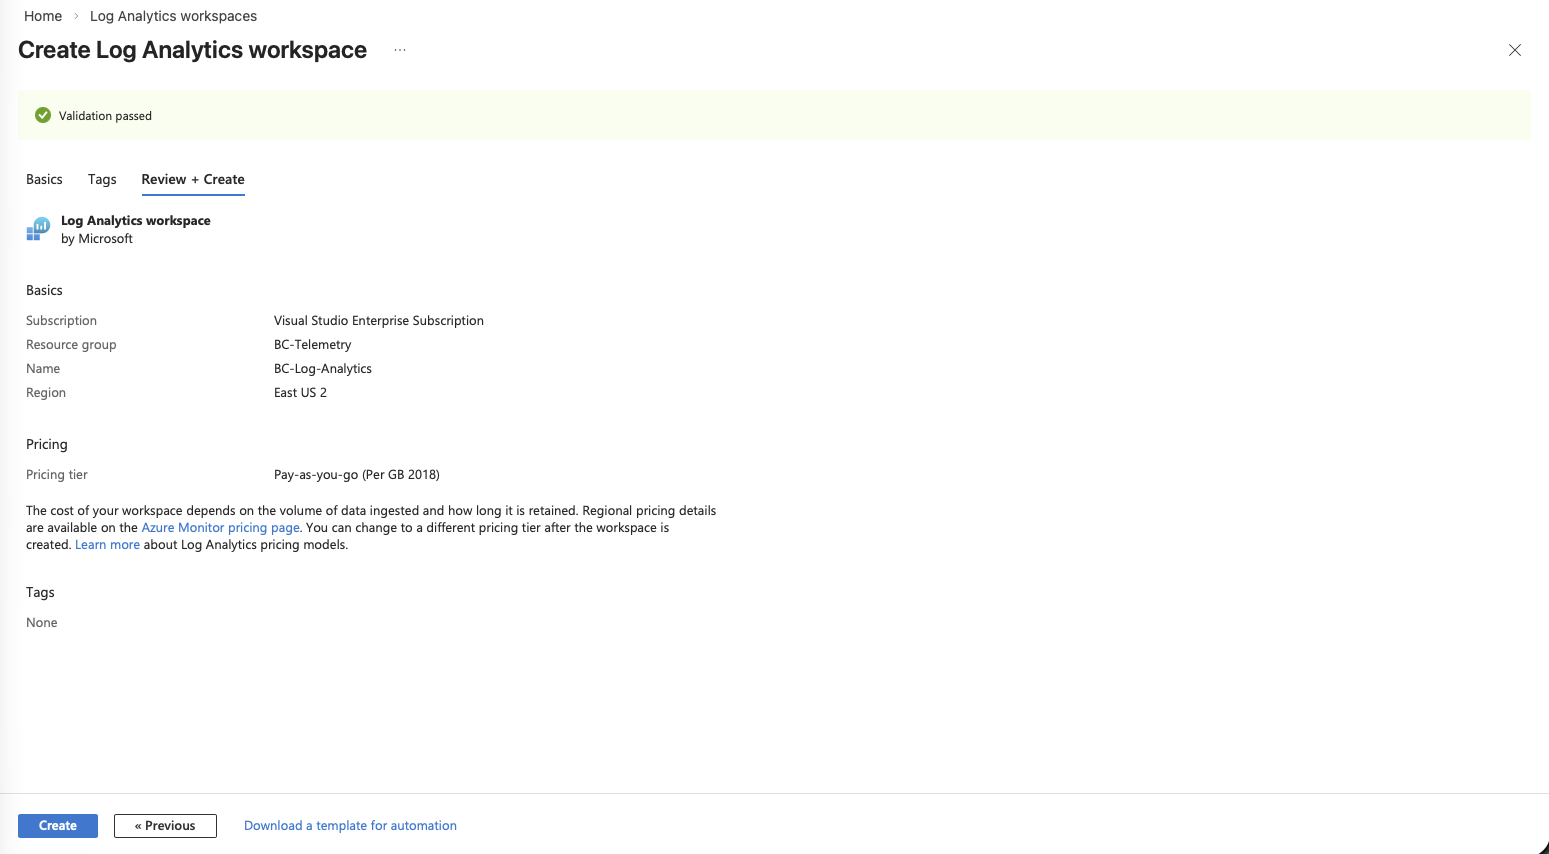
- Click Review + create, then Create.
- Wait for the deployment to complete.
The workspace is where your raw log data lives. You won’t interact with it directly very often—Application Insights provides the query and visualization layer on top—but it’s a required piece of the architecture.
Step 3 — Create an Application Insights Resource
This is the resource that actually receives telemetry from Business Central and gives you access to querying, dashboards, and alerts.
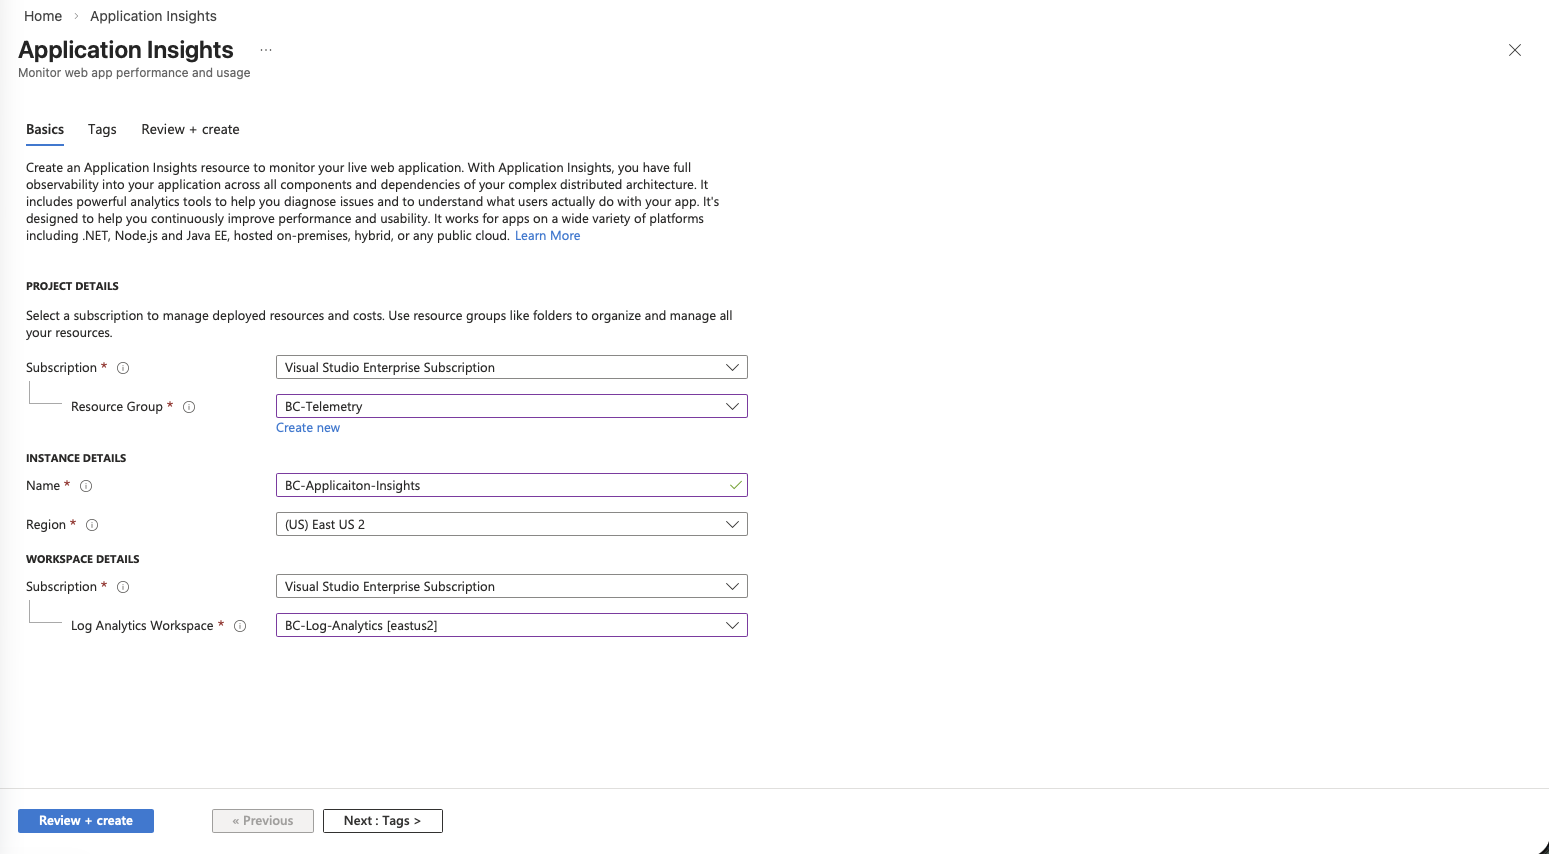
- In the Azure portal, search for Application Insights and select it.
- Click + Create.
- Set the Subscription and Resource group to
BC-Telemetry. - Enter a Name (e.g.,
bc-telemetry-ai). - Select the same Region as your other resources.
- Under Resource Mode, ensure Workspace-based is selected.
- For Log Analytics Workspace, select the
bc-telemetry-lawworkspace you just created. - Click Review + create, then Create.
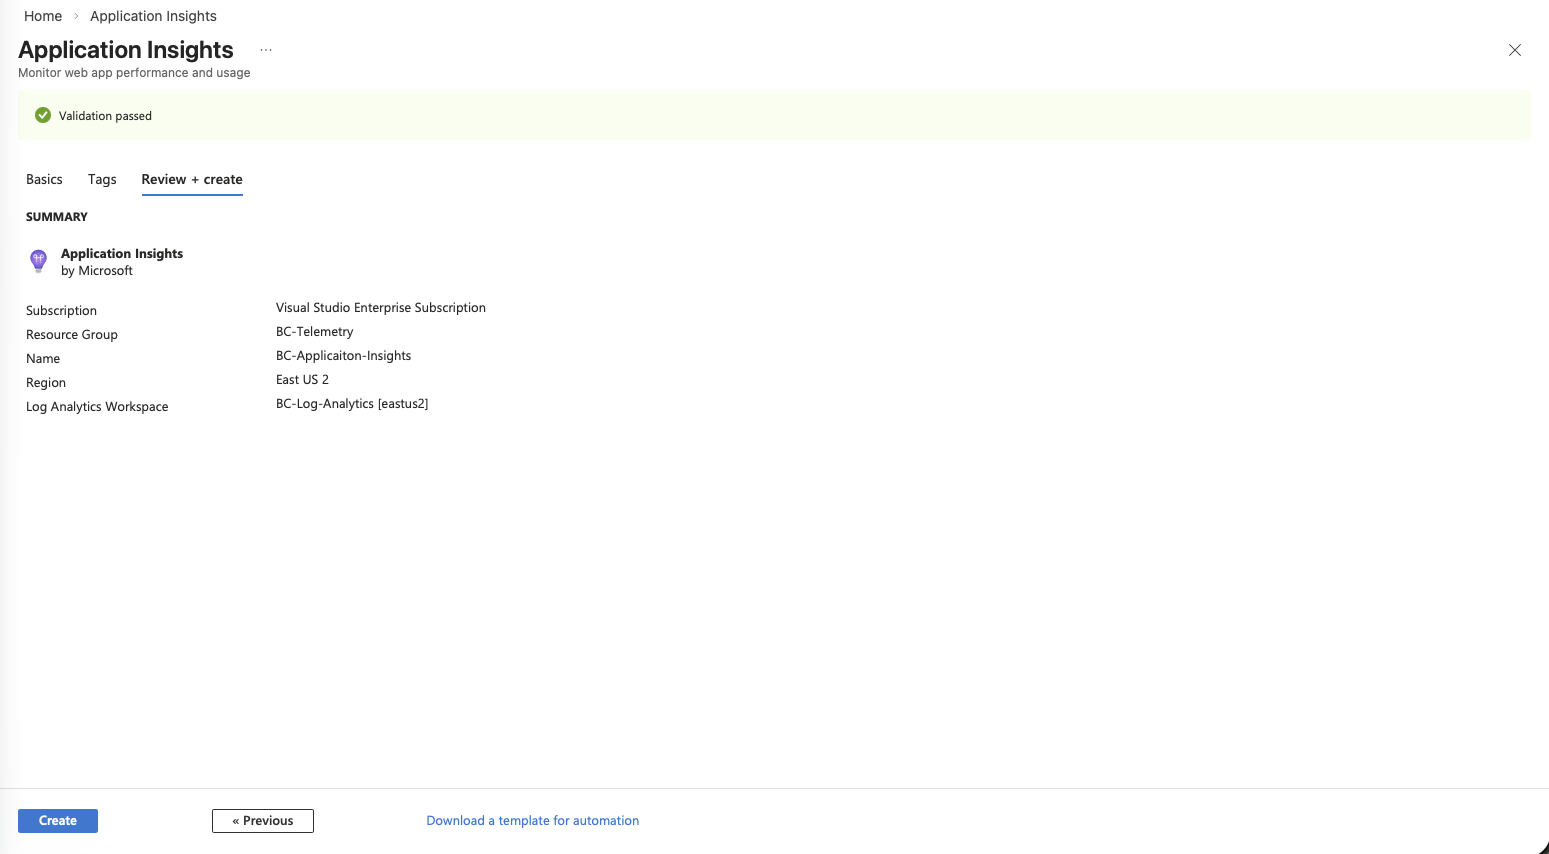
- Once deployed, open the new Application Insights resource.
- On the Overview page, locate the Connection String. Copy it—you’ll need this in the next section.
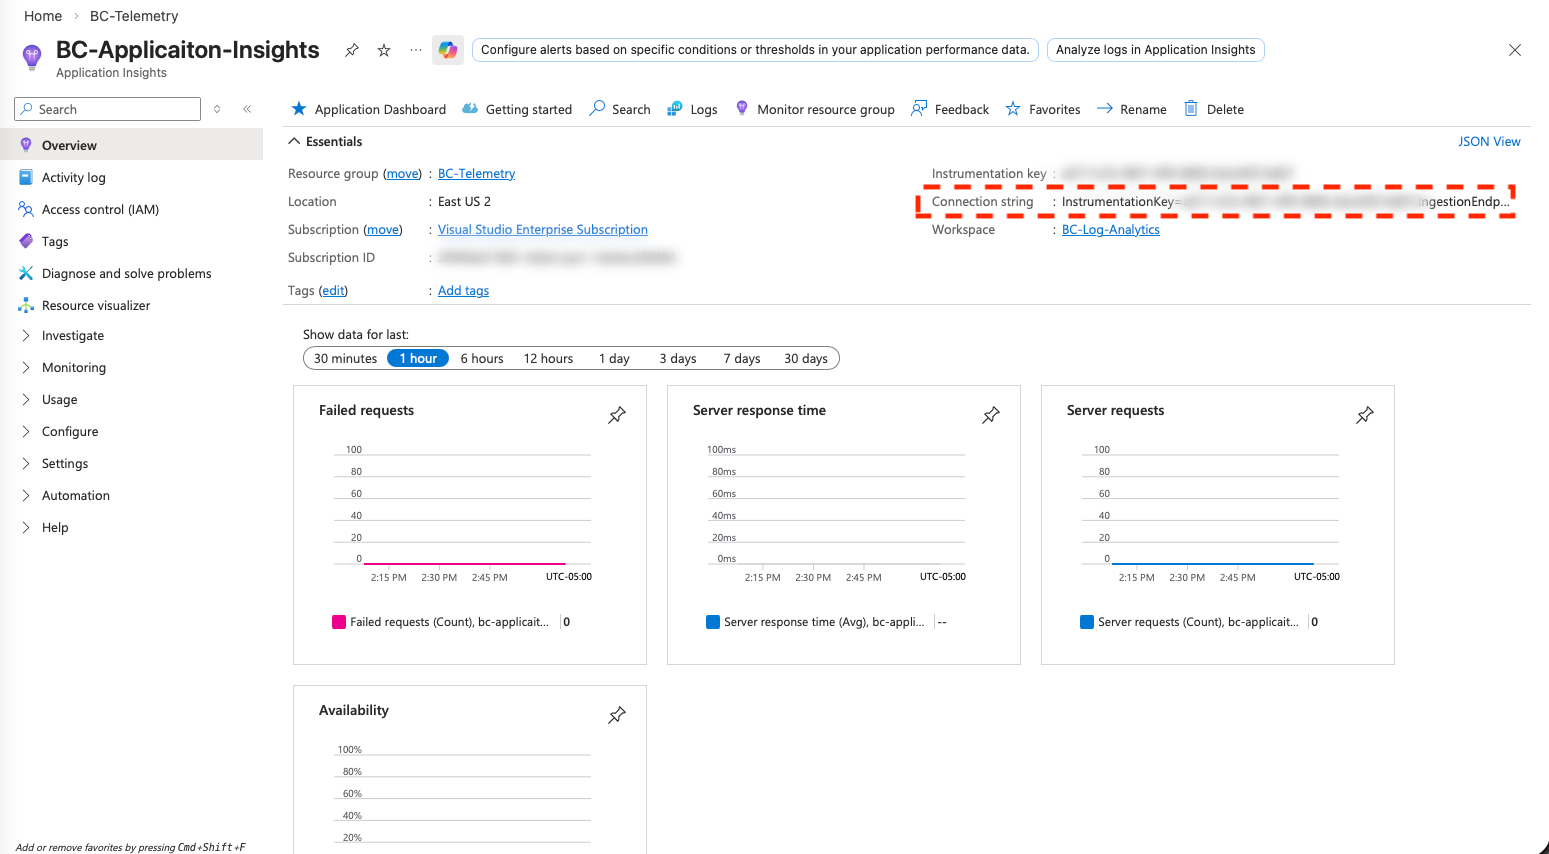
The connection string looks something like:
InstrumentationKey=xxxxxxxx-xxxx-xxxx-xxxx-xxxxxxxxxxxx;IngestionEndpoint=https://eastus-0.in.applicationinsights.azure.com/;...
Keep this value handy. It’s what connects Business Central to your Application Insights resource.
Part 2: Adding the Connection String to Your AL Extension
Once your Application Insights resource is ready, you need to tell Business Central where to send telemetry. There are two places you can configure this:
- Environment level — An admin configures Application Insights on the Business Central environment itself (in the Business Central admin center). This captures all platform and extension telemetry for that environment.
- Extension level — You add the connection string to your extension’s
app.json. This captures telemetry scoped to your extension (specifically events emitted withTelemetryScope::ExtensionPublisherorTelemetryScope::All).
Both approaches can coexist—they serve different purposes. Environment-level telemetry is typically managed by the admin, while extension-level telemetry is managed by the extension publisher. This section focuses on the extension-level configuration.
Configuring app.json
Open your extension’s app.json file and add the applicationInsightsConnectionString property:
{
  "id": "00000000-0000-0000-0000-000000000000",
  "name": "My Extension",
  "publisher": "My Publisher",
  "version": "1.0.0.0",
  "applicationInsightsConnectionString": "InstrumentationKey=00000000-0000-0000-0000-000000000000"
}
A few things to know:
- The property name is
applicationInsightsConnectionString(notapplicationInsightsKey—the older instrumentation key approach still works but connection strings are the current recommendation). - This setting only controls where your extension’s telemetry goes. It doesn’t affect environment-level telemetry.
- If you also use
TelemetryScope::Allin yourLogMessagecalls, those events will be sent to both this resource and the environment’s Application Insights resource (if one is configured). - The connection string is embedded in the published
.appfile, so treat it as non-secret. Application Insights connection strings are designed to be safe to include in client-side code—they only allow ingestion, not reading data.
Configuring the Business Central Environment (Admin Center)
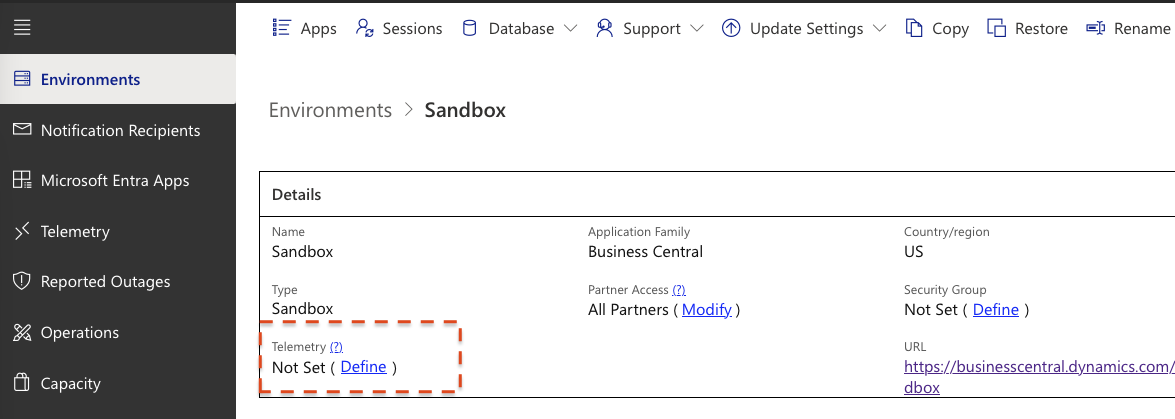
If you’re an admin and want to capture environment-wide telemetry (not just a single extension), you configure Application Insights in the Business Central admin center:
- Open the Business Central admin center.
- Select the environment you want to monitor.
- Click Define under
Telemetryin the Details section. - Enable Telemetry
- Paste the Connection String from your Application Insights resource, into the field for the Azure Application Insights Connection String.
- Click Save.
Once saved, the environment will begin sending platform telemetry—long-running queries, web service calls, report generation times, page views, and more—to your Application Insights resource.
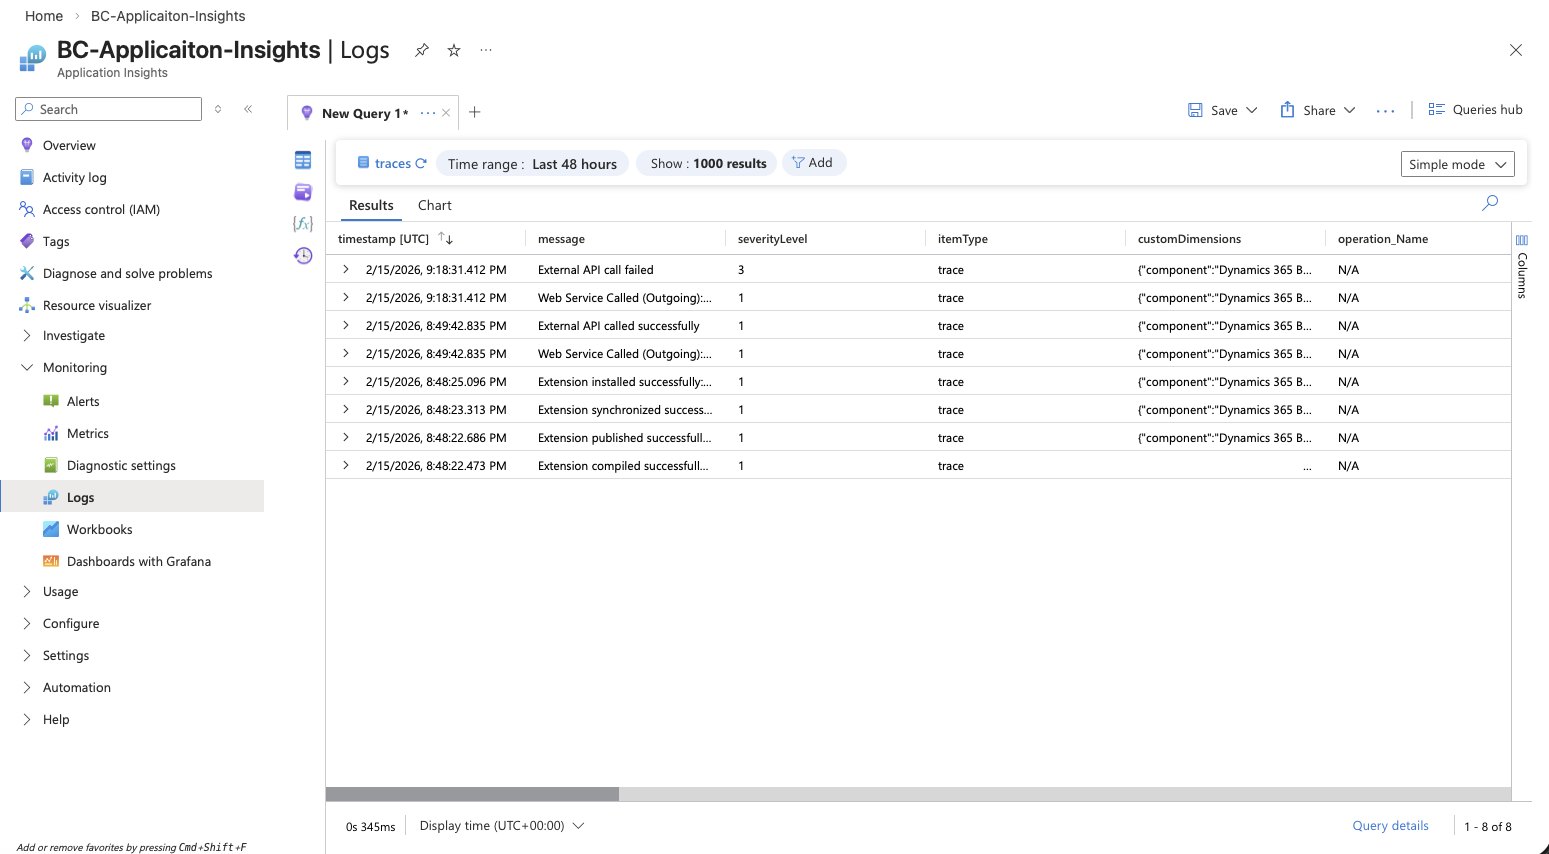
Verifying the Connection
After publishing your extension (or saving the environment configuration), give it a few minutes. Then open your Application Insights resource in the Azure portal and navigate to Logs. Run a simple KQL query:
traces
| where timestamp > ago(1h)
| order by timestamp desc
| take 20
If telemetry is flowing, you’ll see trace records appearing. If your extension emits custom telemetry events, you can filter for those specifically:
traces
traces
| where customDimensions.eventId startswith "al"
| order by timestamp desc
Part 3: Minimizing Data with Transformation Rules
Application Insights charges based on data volume. Business Central environments—especially busy ones—can generate a lot of telemetry. Not all of it is useful for every scenario. Transformation rules let you filter, sample, or drop telemetry data before it’s stored, which directly reduces your costs.
Why Transformation Rules Matter
Without any filtering, a production Business Central environment can easily send gigabytes of telemetry per month. Much of that might be routine page views, verbose-level traces, or events from extensions you don’t need to monitor. Transformation rules let you intercept incoming telemetry and decide what to keep.
Where to Configure Transformations
Transformation rules are configured in the Log Analytics workspace (not directly in Application Insights). They use a feature called Workspace transformations that applies KQL-based rules to incoming data.
Here’s the general approach:
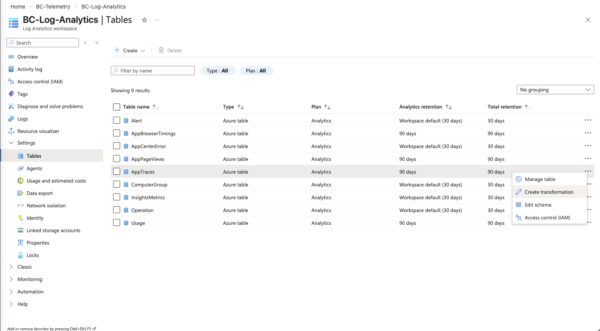
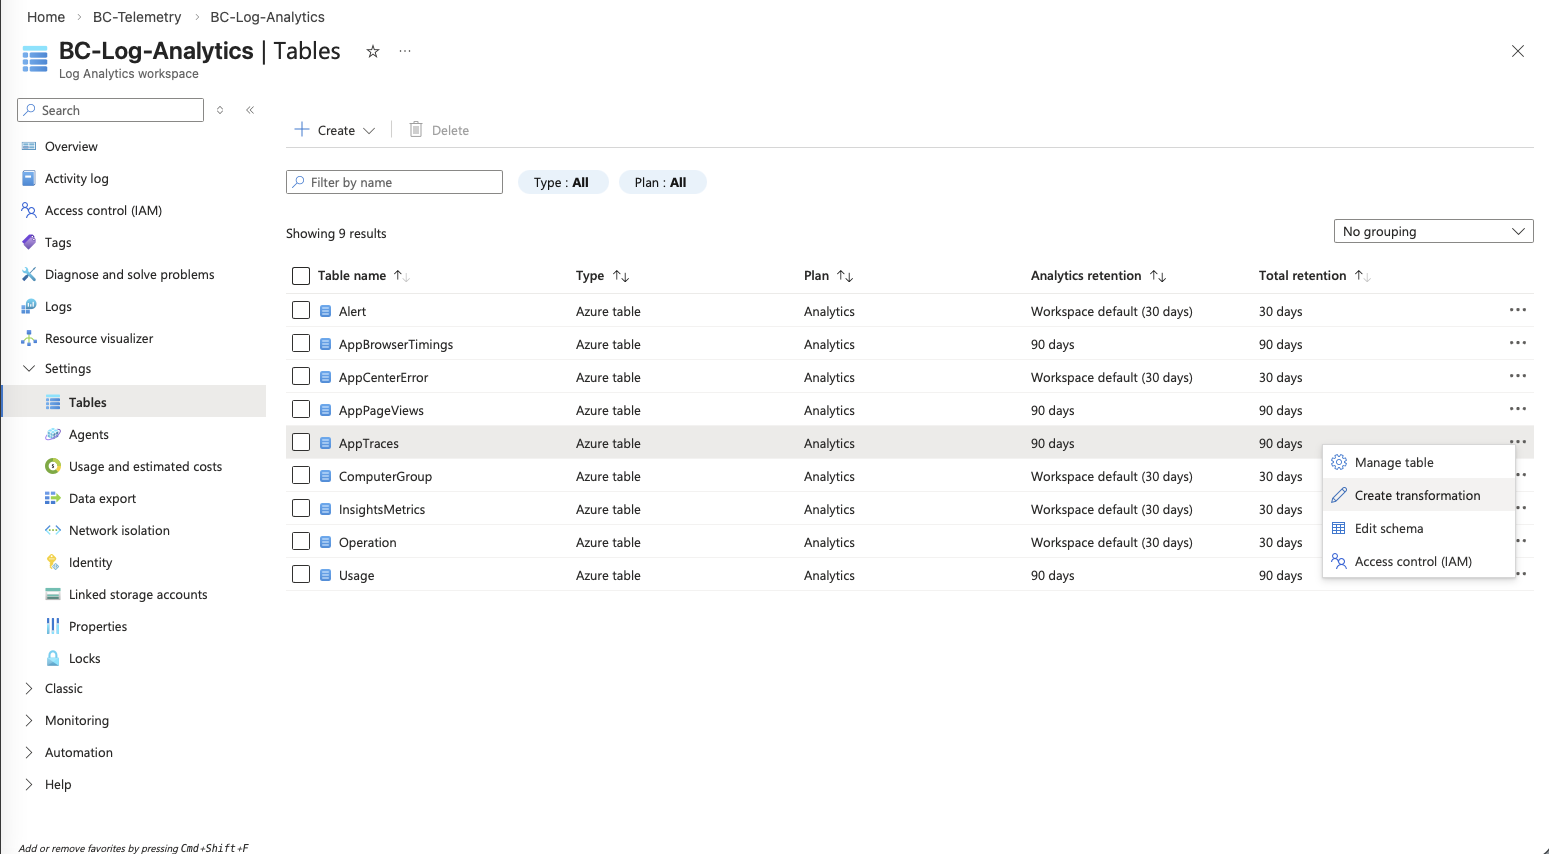
- Open the Log Analytics workspace (
bc-telemetry-law) in the Azure portal. - Navigate to Tables under Settings.
- Find the
AppTracestable (this is where Application Insightstracesdata lands). - Click the ellipsis (…) next to the table and select Create transformation.
- Select an existing one or create a new transformation. Give the transformation a name (e.g.,
FilterVerboseTraces)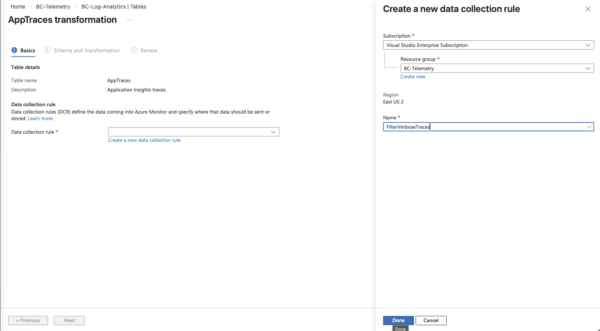
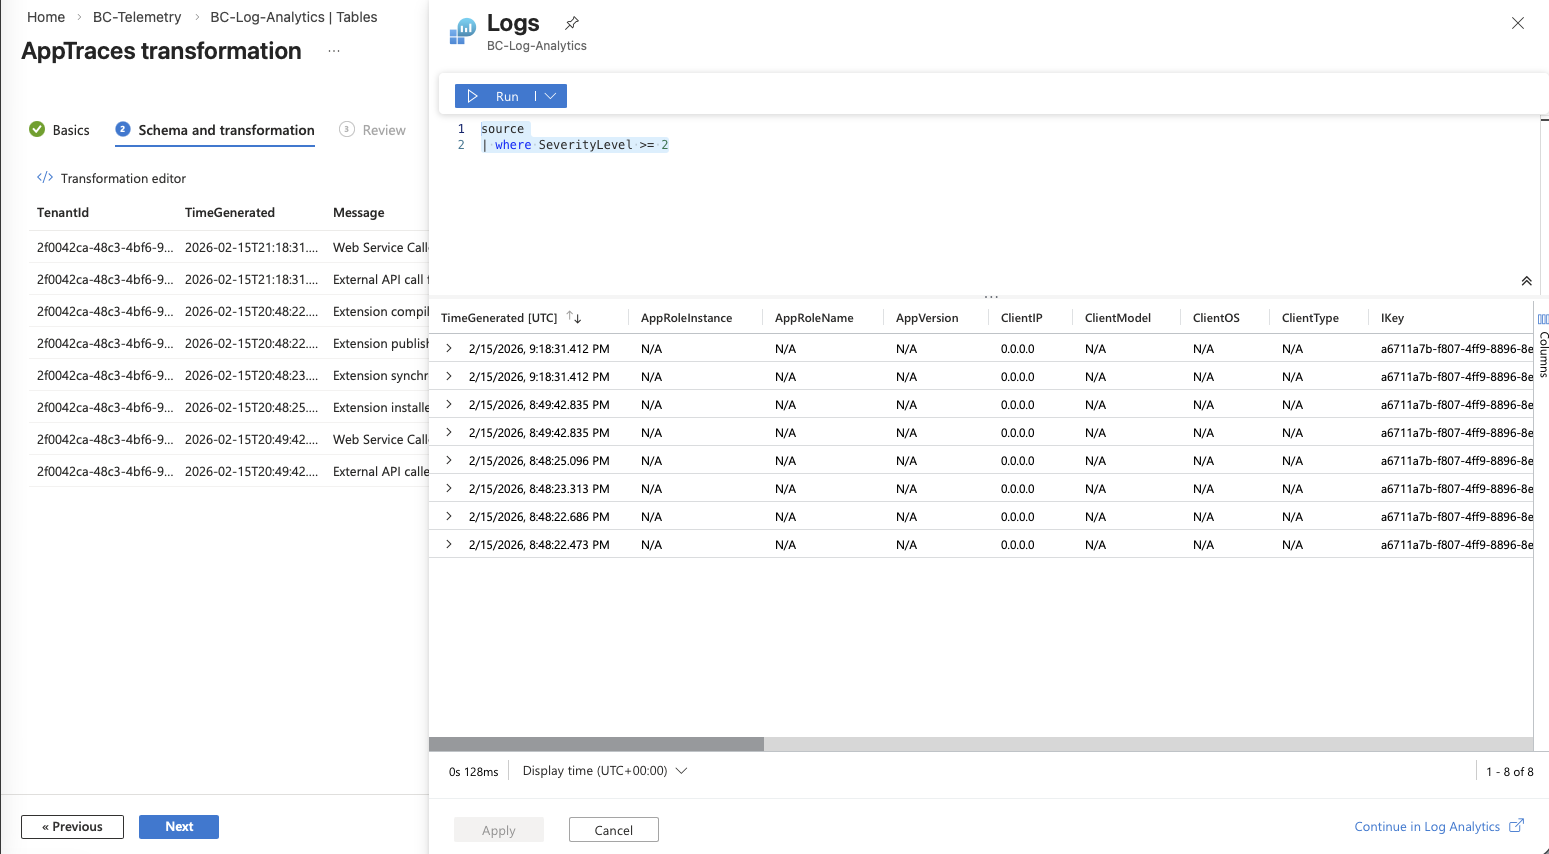
- Select Transformation Editor
- Write a KQL transformation query that filters out the events you don’t want to store.
- Run the transformation query to validate it against recent data.

- Apply the transformation
- Click Next and then Create to activate the transformation.

Example Transformation Rules
Drop verbose-level traces:
source
| where SeverityLevel >= 2
This keeps only Warning, Error, and Critical traces, dropping Verbose and Information level events. Adjust the severity threshold to match your needs.
Keep specific event types you need:
source
| where Properties.eventId startswith "ALDVLPR"
This keeps events with IDs starting with ALDVLPR if you’re monitoring those.
Keep only events from your extension:
source
| where Properties.extensionName == "sessionlogmessage1"
This is aggressive but useful if you’re paying for an Application Insights resource solely to monitor your own extension.
Tips for Transformation Rules
- Start broad, then narrow. Begin by monitoring everything for a week or two, then look at your data volumes in Application Insights to identify what’s taking up the most space. Drop what you don’t need.
- Test with a dev environment first. You don’t want to accidentally drop important production telemetry. Validate your transformation rules against a development or sandbox environment before applying them to production.
- Combine rules. You can chain multiple
whereclauses in a single transformation query to apply several filters at once. - Monitor costs. After applying transformation rules, keep an eye on your Application Insights billing for a week to confirm the expected reduction.
Wrapping Up
Getting Application Insights connected to Business Central is a one-time setup that pays off immediately. With a resource group, Log Analytics workspace, and Application Insights resource in place, you have a centralized location for all the telemetry your environments and extensions generate. Adding the connection string to your app.json takes one line, and transformation rules give you fine-grained control over what data you actually store and pay for.
If you’re emitting custom telemetry events from your extension—and you should be—this infrastructure is what makes them visible and queryable. Start with the basics, get telemetry flowing, and then refine with transformation rules as your data volumes grow.
Learn more:
- Enable Sending Telemetry to Application Insights (Microsoft Learn)
- Monitoring and Analyzing Telemetry (Microsoft Learn)
- Set up workspace transformations in Azure Monitor (Microsoft Learn)
- Custom Telemetry Events in Business Central
Note: The information discussed in this article is for informational and demonstration purposes only. Azure portal interfaces and Business Central admin center options may change over time. This content was written referencing Microsoft Dynamics 365 Business Central 2025 Wave 2 online and the Azure portal as of February 2026. Always test configurations in a sandbox environment first.
1 ping
[…] need an Azure subscription to collect and analyze telemetry data from Business Central. Azure acts as the foundation for storing and processing your telemetry. With […]