
 With each update of Dynamics 365 Business Central, Microsoft enhances what is often referred to as the base application and enhances the development environment. Dynamics 365 Business Central 2022 Wave 1 has several exciting new features in the development environment. One of the exciting features is the In-Client Performance Profiler
In 2021 release wave 2, Microsoft added the AL performance profiler to the Visual Studio Code AL experience. The performance profiler has empowered pro developers to investigate performance as part of developing new functionality and help troubleshoot performance issues in AL code in customer environments.
In 2022 release wave 1, Microsoft takes the performance profiler even further. The in-client performance profiler is a new app page reached on its own or from the Help & Support page.
One note is that it is only possible to capture the current session for the user who starts the profiler in this release wave.
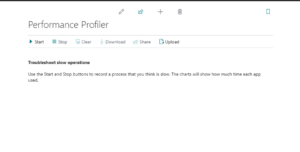
The In-client performance profiler is accessible from the Help and Support Page or by searching for Performance Profiler in the Tell Me feature of Business Central.
This tool makes it easy for consultants and customer administrators to perform initial performance investigations without involving pro developers seamlessly.
Once the In-Client Performance Profiler page is open, click the start action, and perform the operation you’d like to profile from the user session. Once the process completes, use the stop action to end profiling and display the profiler results.
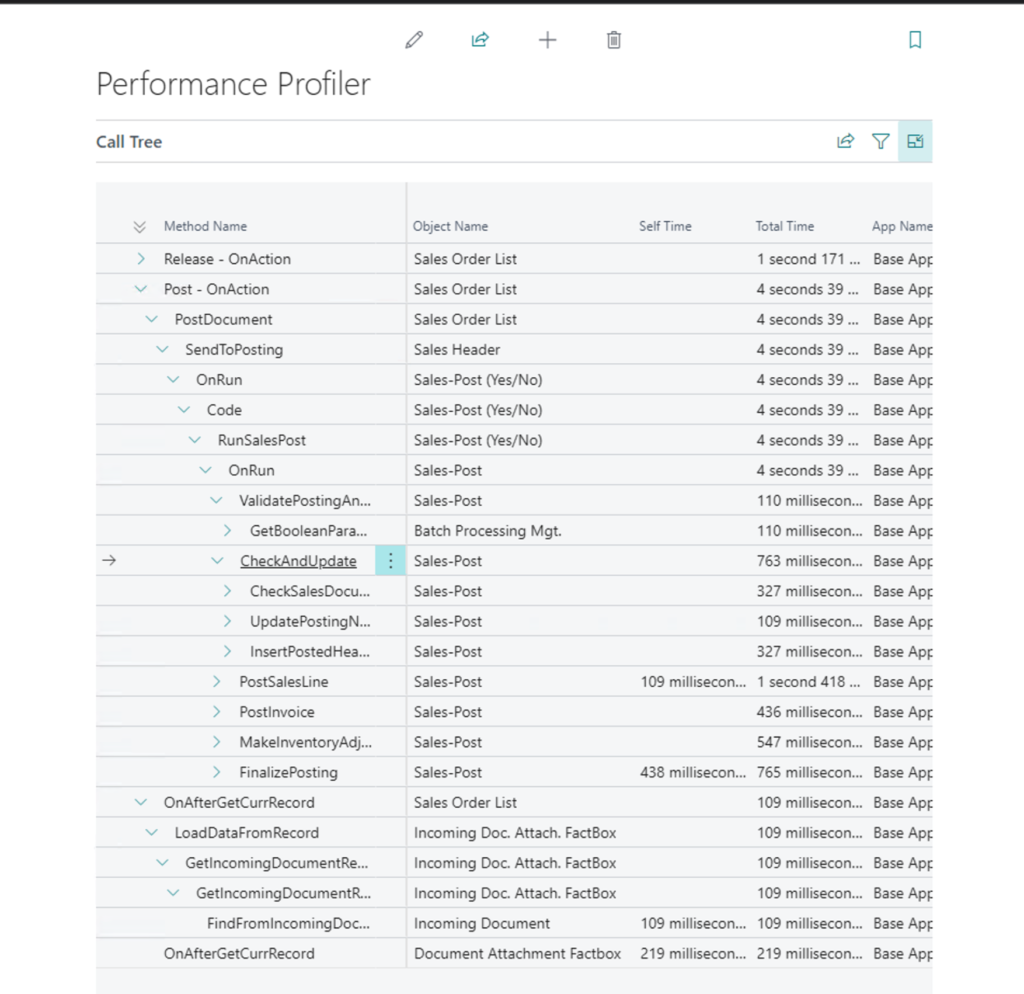 The profiler will display the call tree and the amount of time consumed by each app and process within the call tree. The profiler data is precious information when determining where there may be a performance issue.