
Welcome to Quick Tips — a fast, focused series designed to help you work smarter.
Each post will give you one practical insight you can apply immediately, whether you’re coding, configuring your tools, or improving your workflow.
Here’s today’s Quick Tip:
Turn On Agent Debug Logs to See What Copilot Actually Did
VS Code 1.116 added the ability to view the Agent Debug Log for previous chat sessions, not just the one you’re in. With one setting enabled, every agent session is persisted to disk so you can go back and inspect tool calls, LLM requests, prompt file discovery, token usage, and errors after the fact.
If you’ve ever finished a long agent run and wondered “wait — which instructions actually loaded?” or “why did it skip that tool?”, this is the switch you want flipped.
How to Enable File Logging
- Open Settings (
Cmd + ,on macOS,Ctrl + ,on Windows/Linux) - Search for
github.copilot.chat.agentDebugLog.fileLogging.enabled - Check the box to enable it
Or drop this directly into your settings.json:
{
  "github.copilot.chat.agentDebugLog.fileLogging.enabled": true
}
How to Open a Past Session
- Click the ellipsis (
...) menu in the Chat view and select Show Agent Debug Logs — or run Developer: Open Agent Debug Logs from the Command Palette - Pick a session from the list
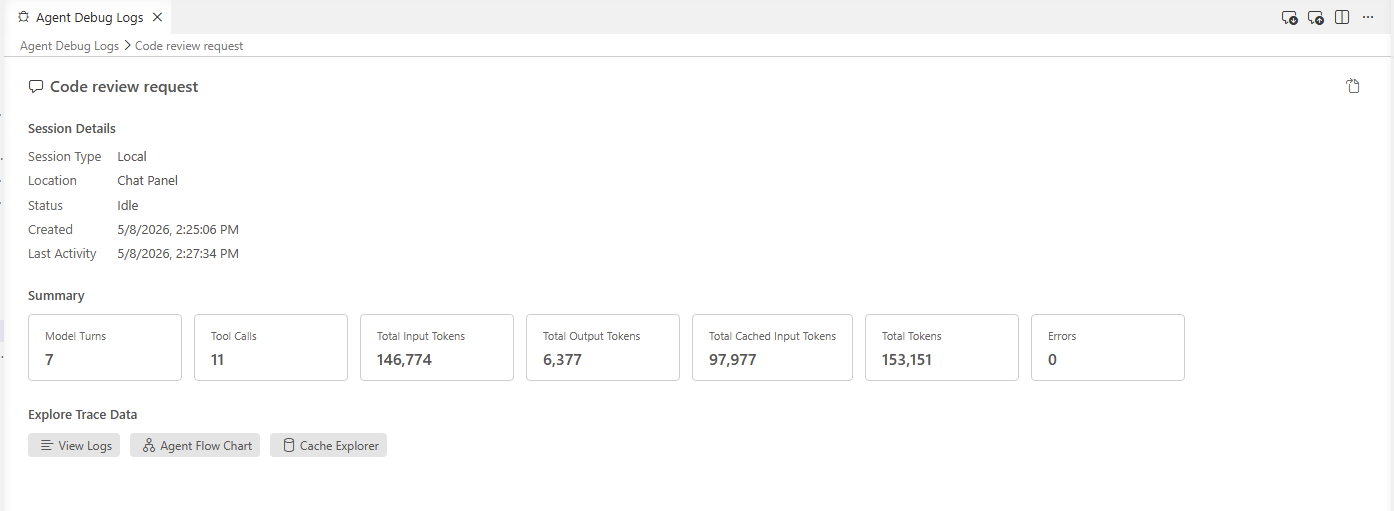
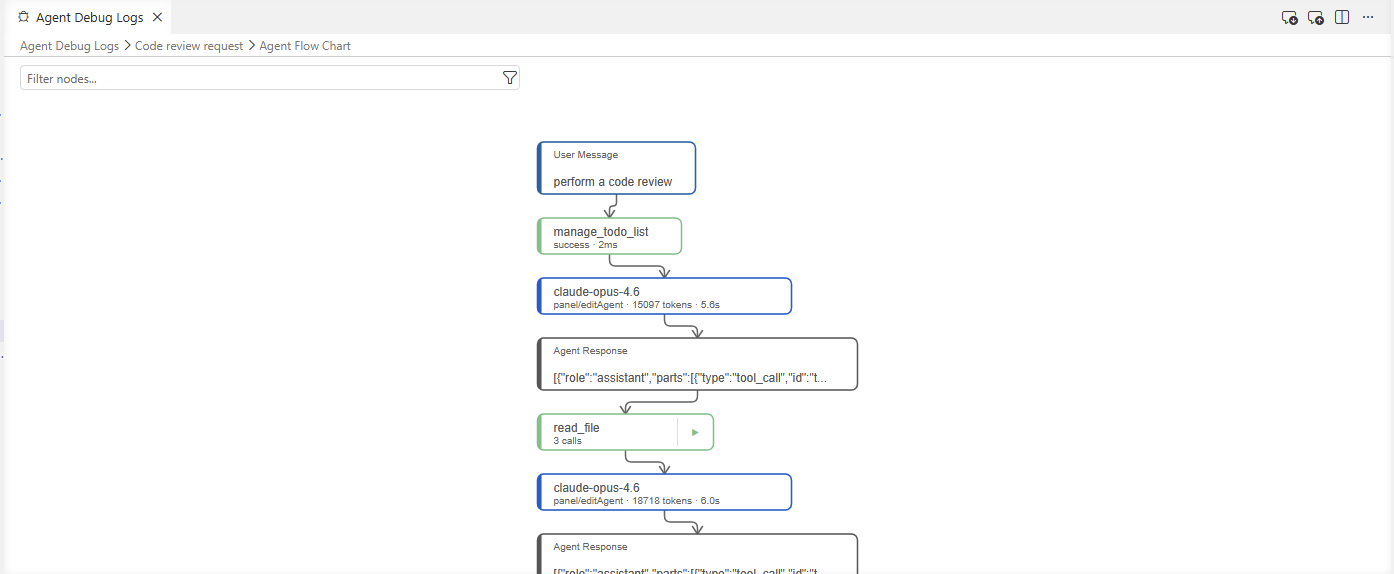
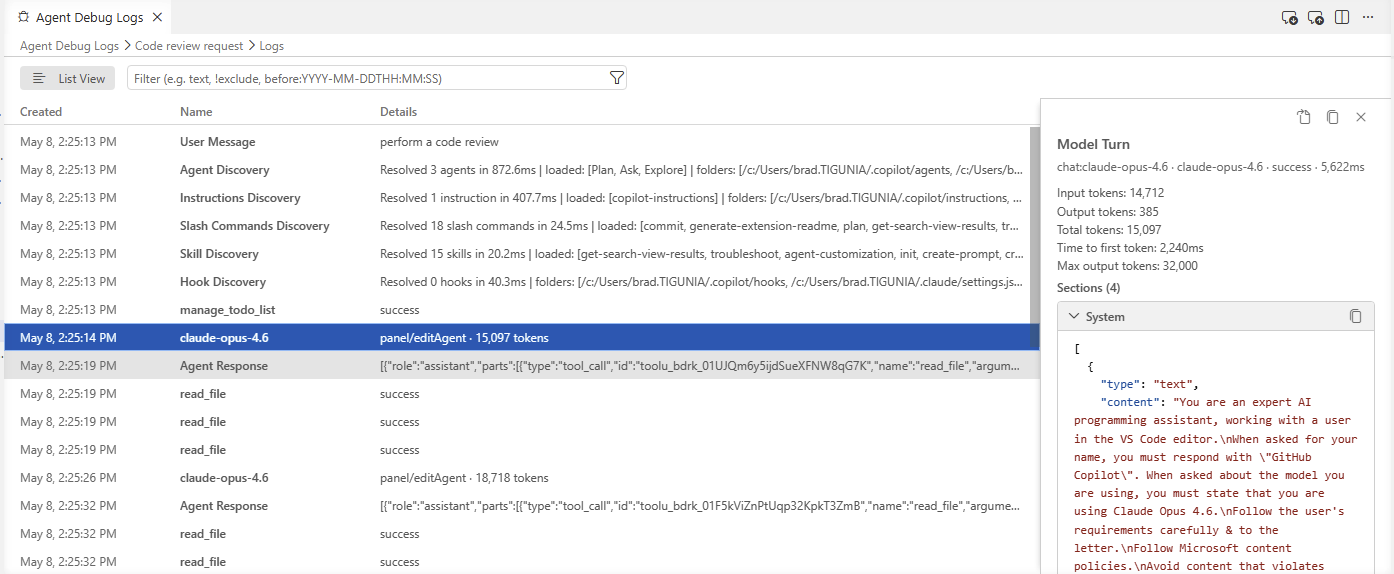
- Switch between Logs, Agent Flow Chart, and Summary views
Export and Import Sessions
The Agent Debug Logs panel toolbar has Export and Import icons in the top-right.
- Export writes the current session to an OpenTelemetry JSON (OTLP) file — handy for sharing a repro with a teammate or archiving a tricky run for later analysis
- Import loads a previously exported JSON file back into the panel, complete with its overview and metrics, just like a live session
Heads up: importing files larger than 50 MB triggers a warning. If you hit it, trim the file or export a shorter session.
Why It Helps
- Debug custom agents, prompt files, and MCP tools without having to reproduce the issue live
- See exactly which customizations loaded (and which were skipped) for any past run
- Audit token usage and tool-call patterns to tune your workflow
- Share repeatable bug reports by exporting a session log instead of pasting screenshots
Note: the Agent Debug Log panel is currently in preview, and logs are stored locally on disk — keep that in mind if your sessions include sensitive context.
Learn more in the Debug chat interactions docs.
Got a favorite shortcut or workflow tweak? Share it in the comments and subscribe to dvlprlife.com for more Quick Tips like this one!