The Change Log has long been part of Microsoft Dynamics 365 Business Central and is used (misused and abused) to track field value changes. The Change Log allows a System Administrator to define which Tables and Fields to monitor for Insert, Modify and Delete events. Once activated, field value changes are visible on the Change Log Entries page.
Before I continue (did I mention how many times I have seen this abused?), it is essential to note that using Change Log or Field Monitor may impact performance and needs to be considered when determining the Table and fields to monitor.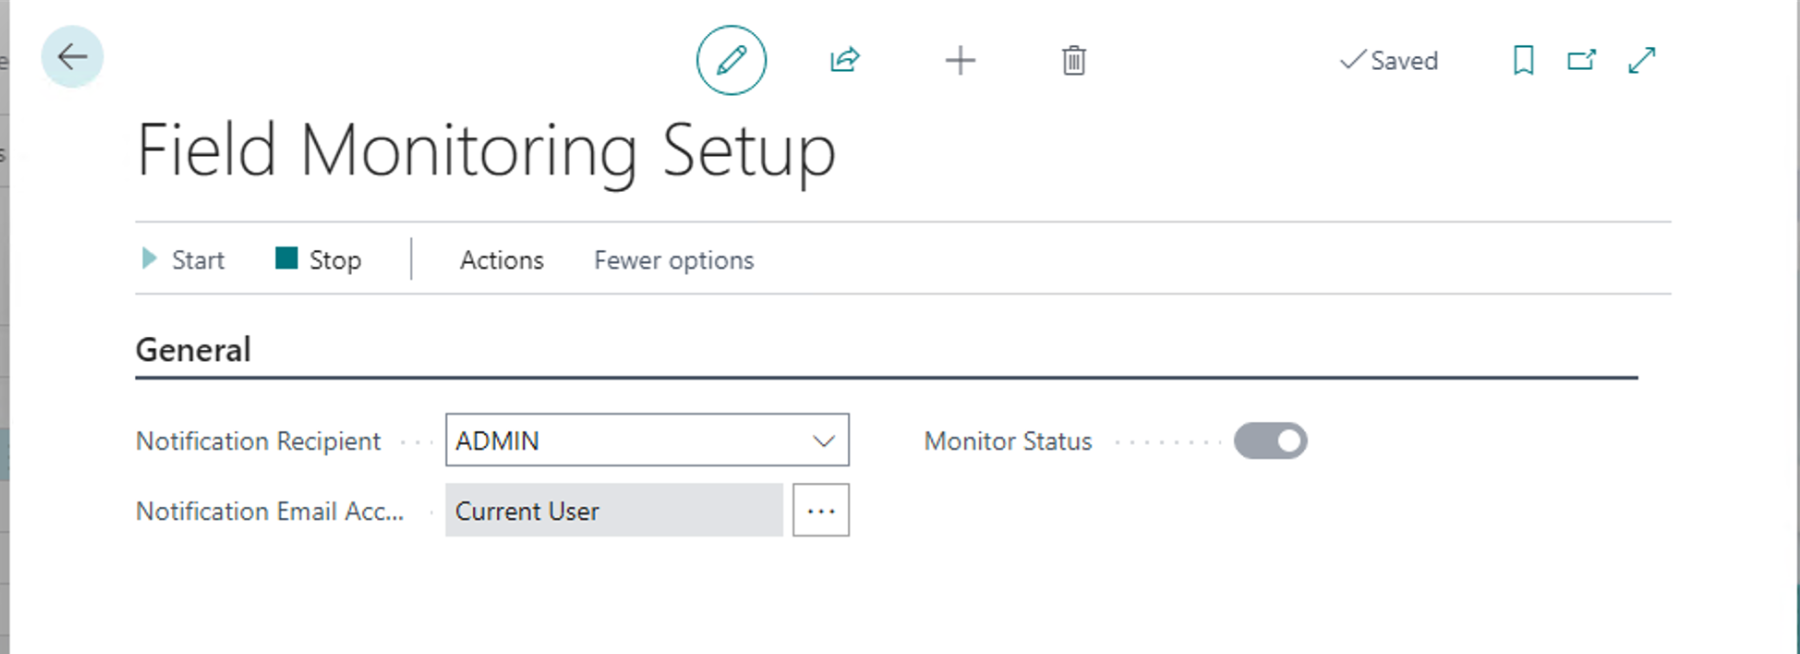
Things changed a bit with the release of 2020 Wave 2 and the addition of the Monitored Field Worksheet. In addition to field change logging, the Monitored Field Worksheet feature added notifications. You can set up notifications when values change on what you may consider sensitive or essential data.
- Enable Field Monitoring Setup:
- Search for “Field Monitoring Setup” using the “Tell Me” action in the App Bar and click the “Field Monitoring Setup” Administration link
- Select the Notification Recipient
- Select the Notification E-mail Account (E-mail set up is a prerequisite)
- Click Start in the Action Ribbon; To disable monitoring click the Stop Action.
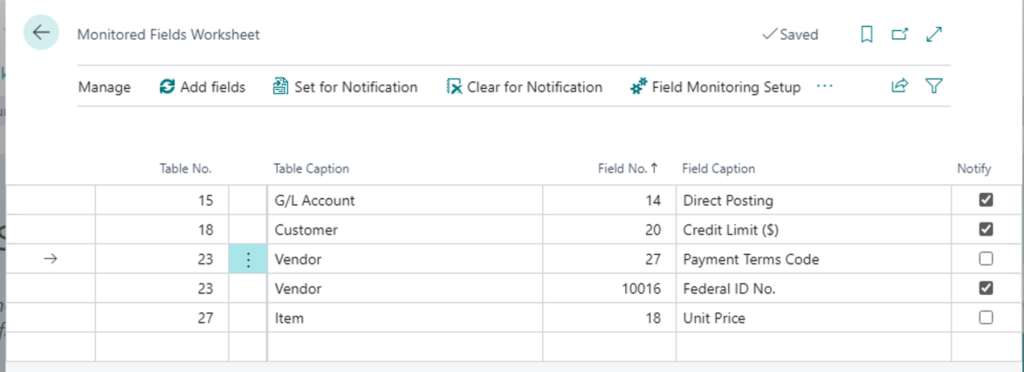
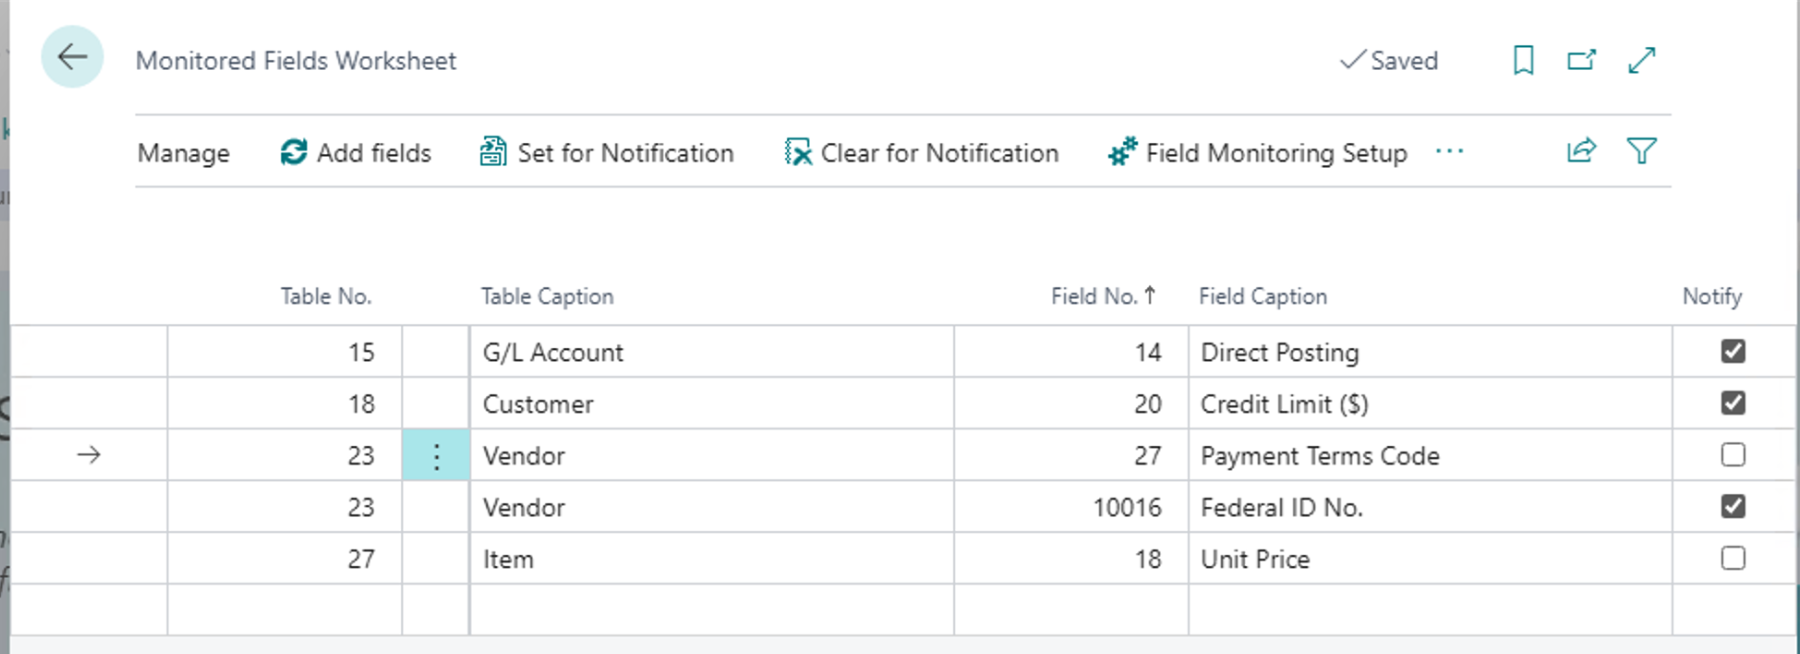
- Set up field change notifications
- Search for “Monitored Field Worksheet” using the “Tell Me” action in the App Bar and click the “Monitored Field Worksheet” Administration link.
- The “Monitored Fields Worksheet” opens, and in the Worksheet, add the Table and Field combinations to monitor.
- Enter the Table number to monitor; this can be entered directly or selected from the Table list that is accessible by clicking the “three dots” adjacent to the field.
- Enter the Field number to monitor; this can be entered directly or selected from the Field list accessible by clicking the “three dots” adjacent to the field.
- Enable the fields to Notify by selecting the rows and selecting the “Set for Notification” action; the “Clear for Notification” action will disable the fields to Notify.
Note: The code and information discussed in this article is for informational and demonstration purposes only. This content was created referencing Microsoft Dynamics 365 Business Central 2022 Wave 1


 available.